SDG Target #12.a

SDG #12 is to “Ensure sustainable consumption and production patterns”

Within SDG #12 are 11 targets, of which we here focus on Target 12.a:

Support developing countries to strengthen their scientific and technological capacity to move towards more sustainable patterns of consumption and production

Target 12.a has one indicator:

  • Indicator 12.a.1: Installed renewable energy-generating capacity in developing and developed countries (in watts per capita) 

Bhutan is the developing country with the largest renewable energy capacity per capita. Following Bhutan are Paraguay, Uruguay and Laos, each with between 1,000-3,000 watts of renewable capacity per capita. Many developing countries still languish with less than 10 watts of renewables capacity per capita.

Sub-Saharan Africa is the region with the lowest capacity, with 37 watts per capita. The region's renewables capacity is on par with all least developed countries. This contrasts with the worldwide renewable's capacity of 268 watts per capita.

SDG Target #12.8

SDG #12 is to “Ensure sustainable consumption and production patterns”

Within SDG #12 are 11 targets, of which we here focus on Target 12.8:

By 2030, ensure that people everywhere have the relevant information and awareness for sustainable development and lifestyles in harmony with nature

Target 12.8 has one indicator:

  • Indicator 12.8.1: Extent to which (i) global citizenship education and (ii) education for sustainable development are mainstreamed in (a) national education policies; (b) curricula; (c) teacher education; and (d) student assessment

This target is like Target 4.7, relating to education on sustainable development and global citizenship, and it’s indicator is a duplicate of 4.7.1, and later to come, indicator 13.3.1

Only about half of all countries have data for teacher education in such topics as of 2020, but all who do tend to score high on an index measuring this. For the measure of curricula, fewer countries again have data. Progress is like the previous measure, with no pattern across regions. For student assessment, many countries are also missing data, but those who report score high for the measure. The picture for national education policies is similar also.

SDG Target #12.7

SDG #12 is to “Ensure sustainable consumption and production patterns”

Within SDG #12 are 11 targets, of which we here focus on Target 12.7:

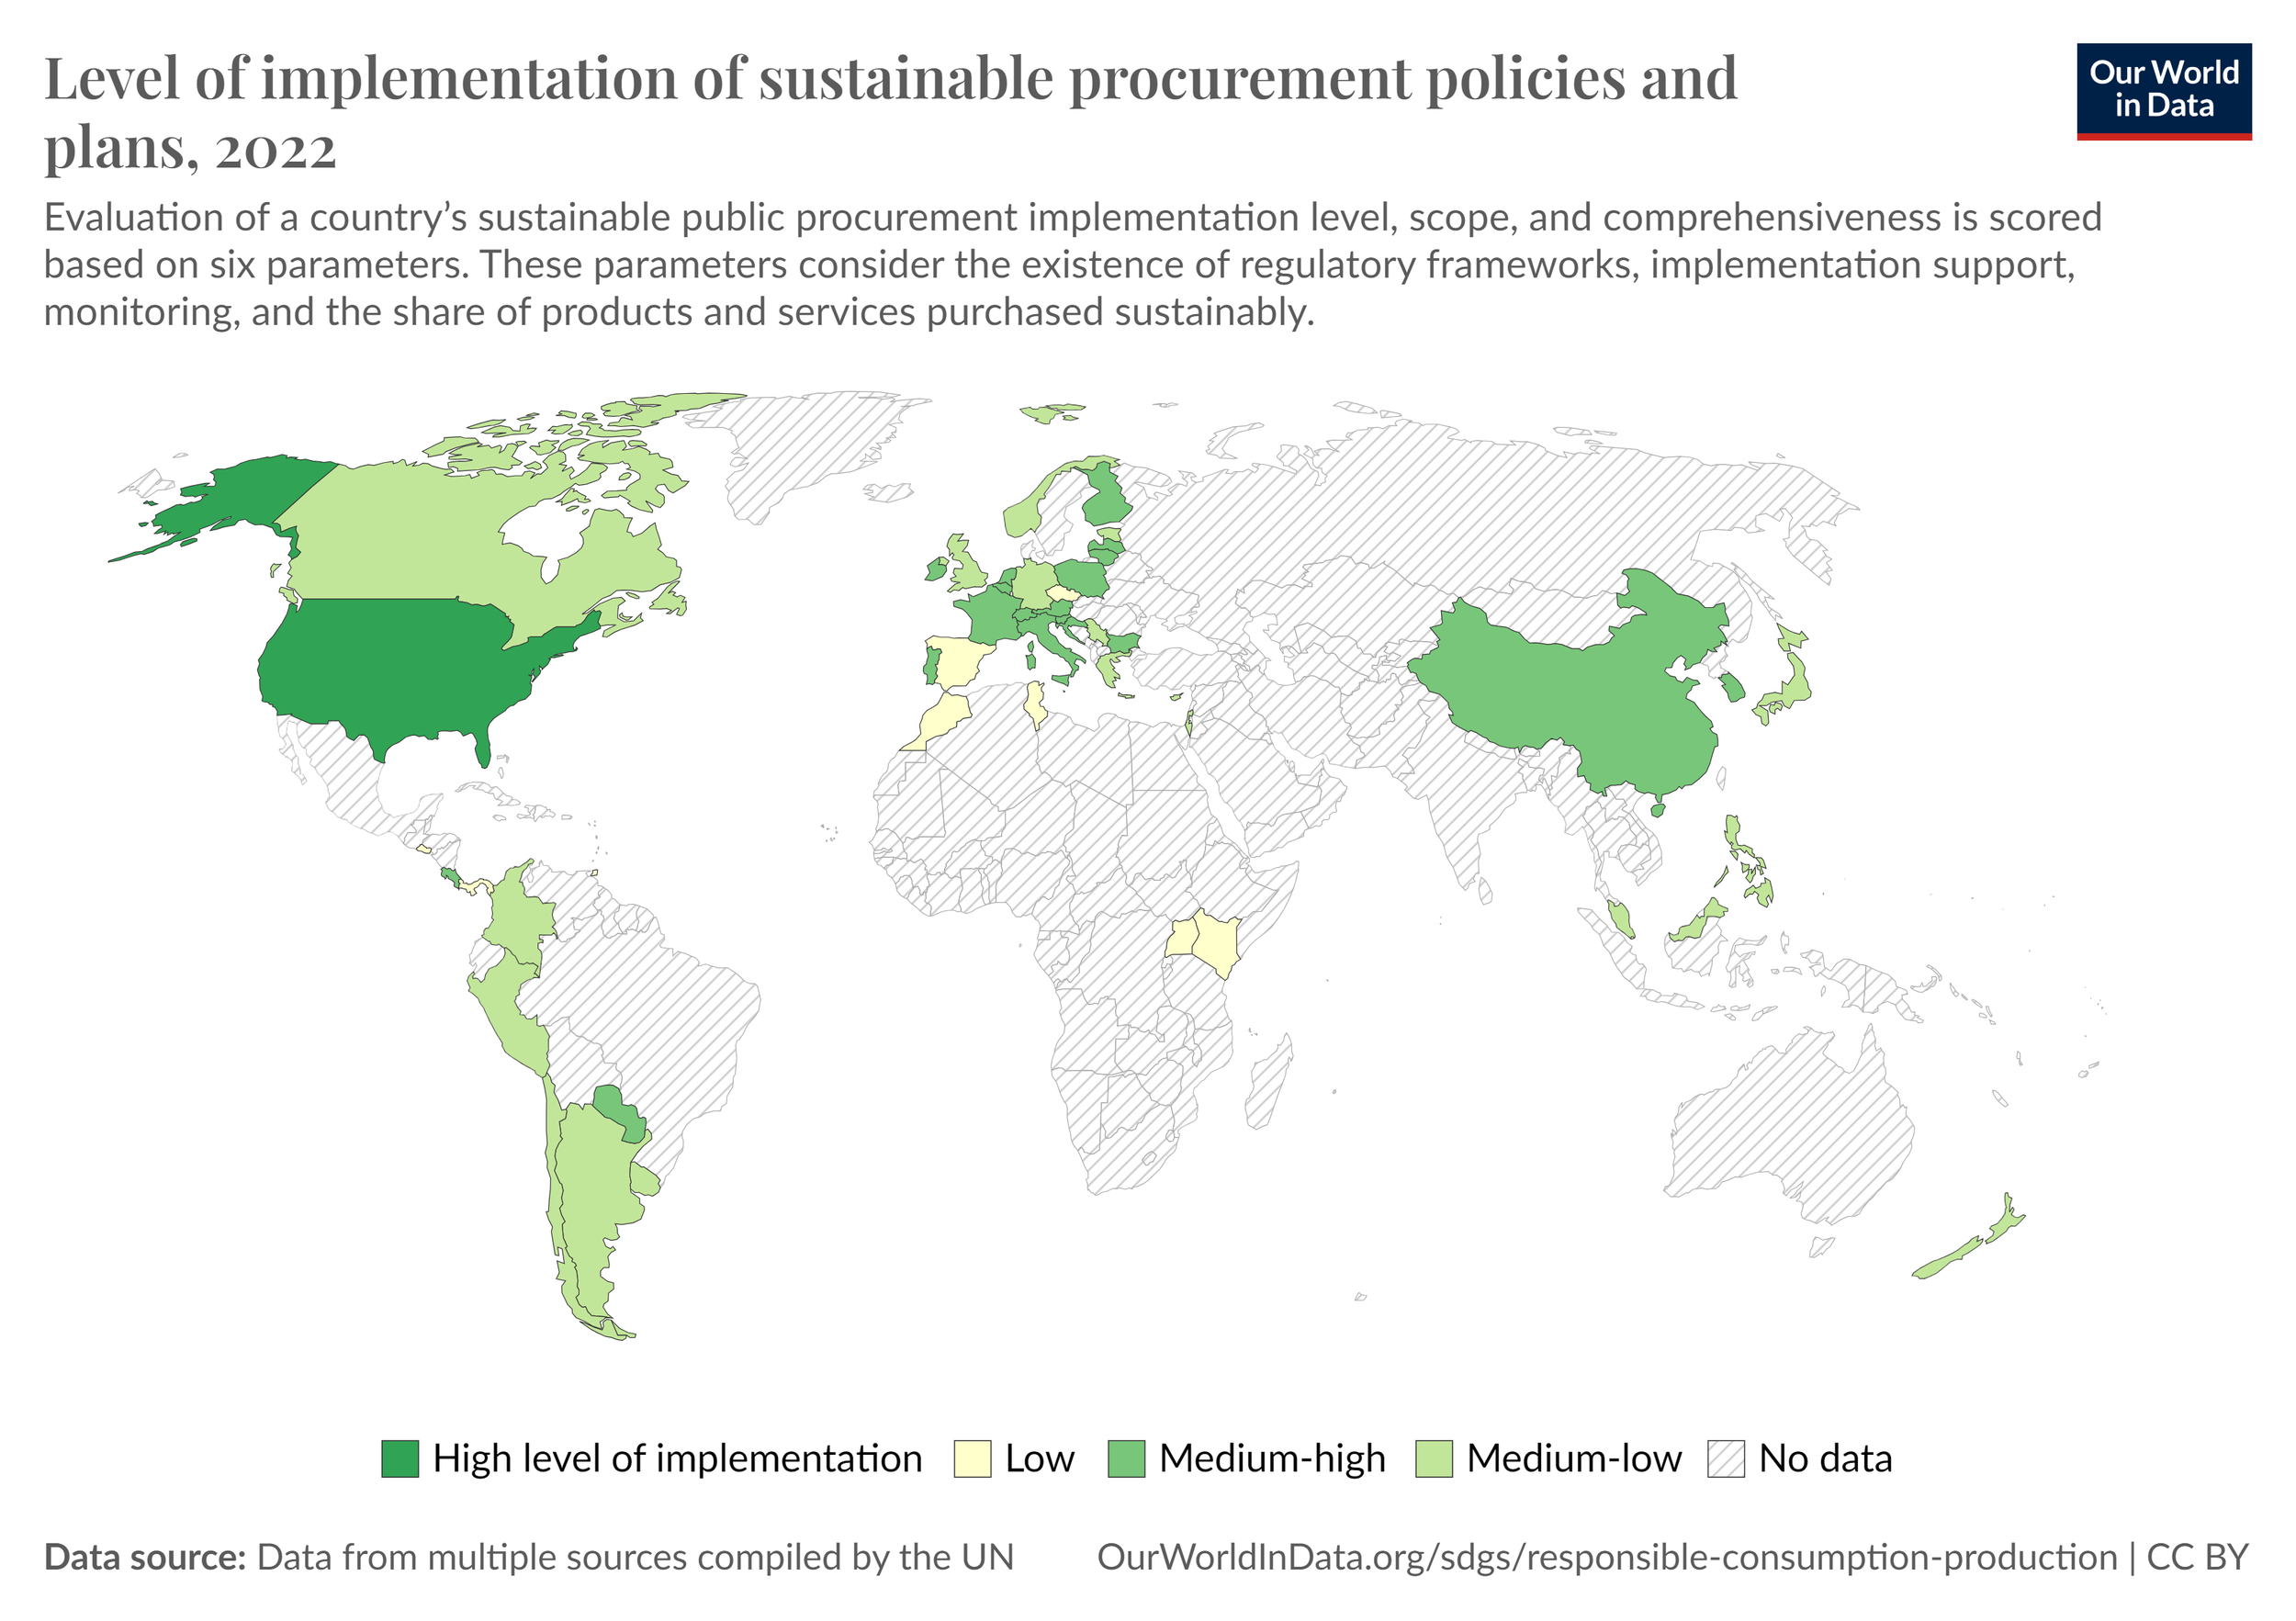
Promote public procurement practices that are sustainable, in accordance with national policies and priorities 

Target 12.7 has one indicator:

  • Indicator 12.7.1: Number of countries implementing sustainable public procurement policies and action plans 

High-income OECD countries spend an estimated 12% of GDP on public procurement in and 30% in developing countries. It’s thus important such government purchasing aligns with the SDGs. 

Not only do governments need to consider what’s the best value for money when assessing what tenders. They also need to factor in sustainability and the costs of buying across a product's life cycle with a reduced environmental impact.

Few countries outside the OECD have data for this indicator as of 2022. The leader is the United States, which has a level of implementation of sustainable public procurement policies. Two high-income countries with low implementation of such plans are Spain and Czechia.

SDG Target #12.6

SDG #12 is to “Ensure sustainable consumption and production patterns”

Within SDG #12 are 11 targets, of which we here focus on Target 12.6:

Encourage companies, especially large and transnational companies, to adopt sustainable practices and to integrate sustainability information into their reporting cycle

Target 12.6 has one indicator:

  • Indicator 12.6.1: Number of companies publishing sustainability reports

The country with the most companies publishing sustainability reports as of 2021 is the US, leading with 1,169. Following are China, the UK, Japan, and Malaysia.

Worldwide, a total of 6,522 companies produced such reports in 2021, up from 2,276 in 2016, the year after the adoption of the Goals.

SDG Target #12.5

SDG #12 is to “Ensure sustainable consumption and production patterns”

Within SDG #12 are 11 targets, of which we here focus on Target 12.5:

By 2030, substantially reduce waste generation through prevention, reduction, recycling and reuse

Target 12.5 has one indicator:

  • Indicator 12.5.1: National recycling rate, tons of material recycled

In the waste hierarchy, if we’ve neither prevented, reduced or reused waste, we at least need to ensure its recycled rather than go to landfill

A lot of countries don’t have data for the municipal waste recycled within their borders. The developed countries are the most pertinent, as they create the most waste. The biggest amount recycled were in Germany, France, Italy, South Africa, and the UK. Among the high-income countries OECD countries, the US and Canada didn’t have data. Nor did Australia and New Zealand, and Japan and South Korea.

The world recycled only 17% of its e-waste as of 2019, showing no reduction since the adoption of the SDGs.

SDG Target #12.4

SDG #12 is to “Ensure sustainable consumption and production patterns”

Within SDG #12 are 11 targets, of which we here focus on Target 12.4:

By 2020, achieve the environmentally sound management of chemicals and all wastes throughout their life cycle, in accordance with agreed international frameworks, and significantly reduce their release to air, water and soil in order to minimize their adverse impacts on human health and the environment

Target 12.4 has two indicators:

  • Indicator 12.4.1: Number of parties to international multilateral environmental agreements on hazardous waste, and other chemicals that meet their commitments and obligations in transmitting information as required by each relevant agreement

  • Indicator 12.4.2: (a) Hazardous waste generated per capita; and (b) proportion of hazardous waste treated, by type of treatment

The international environmental agreements used to measure indicator 12.4.1 include:

  • Rotterdam Convention on the international trade of hazardous chemicals and pesticides. All countries have ratified, except a few e.g. USA, Angola, Tajikistan

  • Montreal Protocol of 1987 on ozone-depleting substances

  • Minamata Convention on Mercury, named after the Japanese city. Mercury poisoning from this toxic metal, known as Minamata disease, was first identified in this city.

  • Stockholm Convention on persistent organic pollutants (POPs). All countries have ratified except USA, Israel, Malaysia, and Haiti.

  • Basel Convention of 1989 on transboundary hazardous waste disposal. Only the USA and Haiti have not ratified

The above agreements oblige countries which are parties to report to the respective secretariats. As of 2020, parties to the Montreal Protocol submitted all required information. For the Rotterdam Convention, this was three-quarters of what’s required. For the Basel Convention, this was 60%, and half of what’s required for the Stockholm Convention.

A lot of countries don’t have data for hazardous waste per capita as of 2021. Among those who do, Kazakhstan has produced the most, with 9,624kg per capita.

Indicator 12.4.2 asks us for the proportion of hazardous waste treated by type. Only a handful of countries have reported how many tonnes they’ve either recycled, incinerated, sent to landfill or managed another way.

SDG Target #12.3

SDG #12 is to “Ensure sustainable consumption and production patterns”

Within SDG #12 are 11 targets, of which we here focus on Target 12.3:

By 2030, halve per capita global food waste at the retail and consumer levels and reduce food losses along production and supply chains, including post-harvest losses

Target 12.3 has one indicator, with two parts:

  • Indicator 12.3.1: (a) Food loss index and (b) food waste index 

The UN Environment Programme presents the Food Waste Index, the most recent edition issued in 2024. Food loss accounts for waste from the farm to retail before sale to consumers.

The World Food Loss Index in 2021 was 98.3. The index measures the percentage of food lost compared to the baseline of 2015, suggesting there’s not yet been a reduction in the SDG period.

SDG Target #12.2

SDG #12 is to “Ensure sustainable consumption and production patterns”

Within SDG #12 are 11 targets, of which we here focus on Target 12.2:

By 2030, achieve the sustainable management and efficient use of natural resources

Target 12.2 has two indicators:

  • Indicator 12.2.1: Material footprint, material footprint per capita, and material footprint per GDP

  • Indicator 12.2.2: Domestic material consumption, domestic material consumption per capita, and domestic material consumption per GDP

Domestic material consumption means all the materials used by an economy. The material flow accounting used to measure these flows captures the extraction of natural resources. It follows its path onto the resource's later trade, eventual disposal, and any related emissions.

As of 2019, the global material footprint per capita is 12 tonnes, unchanged since the adoption of the SDGs in 2015. This is equal to a kilogram of material footprint per dollar of economic output worldwide, also little changed since 2015.

The worst performers for domestic material consumption per capita as of 2019 are Canada, Chile, and Mongolia. Each of these countries consumed 50-60 tonnes of materials. Measuring the efficiency of material use per dollar created in the economy, the worst performer was Somalia. It consumed 33 kg of materials per dollar of GDP, though its per capita consumption was among the lowest.

SDG Target #12.1

SDG #12 is to “Ensure sustainable consumption and production patterns”

Within SDG #12 are 11 targets, of which we here focus on Target 12.1:

Implement the 10‑Year Framework of Programmes on Sustainable Consumption and Production Patterns, all countries taking action, with developed countries taking the lead, taking into account the development and capabilities of developing countries

Target 12.1 has one indicator:

  • Indicator 12.1.1: Number of countries developing, adopting or implementing policy instruments aimed at supporting the shift to sustainable consumption and production

For this target to have success, all government ministries and industrial sectors need to take part in stewardship of the one planet we have.

There’s a big global data gap for this indicator. Although all countries which have reported data as of 2022 have a sustainable consumption and production plan. The target asks for the developed countries to take the lead. This is as they tend to have the worst outcomes in sustainable production and consumption anyhow. To this end, the US has such a plan, but Canada doesn’t have data. Most EU countries have a plan, though there are some large exceptions without data. Japan, South Korea, Israel, and New Zealand don’t have data, but Australia has a plan.

SDG Target #11.c

SDG #11 is to “Make cities and human settlements inclusive, safe, resilient and sustainable”

Within SDG #11 are 10 targets, of which we here focus on Target 11.c:

Support least developed countries, including through financial and technical assistance, in building sustainable and resilient buildings utilizing local materials

It may seem incredulous, but beyond the halfway point of the SDG period, the UN is yet to develop an indicator for this target. This is an opportunity to introduce us to the concept of the classification of SDG indicators into three tiers. 

For one of the official UN indicators to be Tier 1, the underlying concepts need to be clear. A method to measure needs to exist, and half of all countries must produce data with regularity

Tier 2 is the same, except countries produce data less. In the instance of Tier 3 indicators, such as relates to Target 11.c, there’s not yet a method available, but ones are being developed.

SDG Target #11.b

SDG #11 is to “Make cities and human settlements inclusive, safe, resilient and sustainable”

Within SDG #11 are 10 targets, of which we here focus on Target 11.b:

By 2020, substantially increase the number of cities and human settlements adopting and implementing integrated policies and plans towards inclusion, resource efficiency, mitigation and adaptation to climate change, resilience to disasters, and develop and implement, in line with the Sendai Framework for Disaster Risk Reduction 2015–2030, holistic disaster risk management at all levels

Target 11.b has two indicators:

  • Indicator 11.b.1: Number of countries that adopt and implement national disaster risk reduction strategies in line with the Sendai Framework for Disaster Risk Reduction 2015–2030

  • Indicator 11.b.2: Proportion of local governments that adopt and implement local disaster risk reduction strategies in line with national disaster risk reduction strategies

We’re here reintroduced to the Sendai Framework, covered earlier in this series in target 1.5. Many countries are without data for indicator 11.b.1. UNDRR uses an index to measure implementation of disaster risk reduction policies. Most countries with data have made some progress. The lowest implementation is in Saudi Arabia, Bangladesh, Nepal, Laos, and Jamaica.

The progress for the second indicator for Target 11.b relating to local government disaster risk reduction is also a patchwork. Across countries, there's no identifiable patterns in adoption of such strategies.

SDG Target #11.a

SDG #11 is to “Make cities and human settlements inclusive, safe, resilient and sustainable”

Within SDG #11 are 10 targets, of which we here focus on Target 11.a:

Support positive economic, social and environmental links between urban, peri-urban and rural areas by strengthening national and regional development planning

Target 11.a has one indicator:

  • Indicator 11.a.1: Number of countries that have national urban policies or regional development plans that (a) respond to population dynamics; (b) ensure balanced territorial development; and (c) increase local fiscal space 

According to UN Habitat, a national urban policy is: 

A coherent set of decisions derived through a deliberate government-led process of coordinating and rallying various actors for a common vision and goal that will promote more transformative, productive, inclusive and resilient urban development for the long term

UN Habitat facilitates the Urban Policy Platform. This is a knowledge base to help countries develop best practices in crafting their national urban policies in pursuit of the aims of SDG #11.

Let’s consider the countries which have urban policies responding to the three clauses of this indicator. These are population dynamics, balanced territorial development, and fiscal space.

As of 2020, neither the US nor Canada have such policies, though but a handful of the rest of the Americas do. Likewise in Africa, all but a few have such national urban policies. All of Eurasia and Oceania seems to, except North Macedonia, Azerbaijan, North Korea, Russia and some microstates. 

SDG Target #11.7

SDG #11 is to “Make cities and human settlements inclusive, safe, resilient and sustainable”

Within SDG #11 are 10 targets, of which we here focus on Target 11.7:

By 2030, provide universal access to safe, inclusive and accessible, green and public spaces, in particular for women and children, older persons and persons with disabilities

Target 11.7 has two indicators:

  • Indicator 11.7.1: Average share of the built-up area of cities that is open space for public use for all, by sex, age and persons with disabilities

  • Indicator 11.7.2: Proportion of persons victim of non-sexual or sexual harassment, by sex, age, disability status and place of occurrence, in the previous 12 months

The latter indicator recalls the target 5.2 covered before in this series.

There’s not yet any international data available for the first indicator of this target. For the second indicator, only a dismal six countries have data.

SDG Target #11.6

SDG #11 is to “Make cities and human settlements inclusive, safe, resilient and sustainable”

Within SDG #11 are 10 targets, of which we here focus on Target 11.6:

By 2030, reduce the adverse per capita environmental impact of cities, including by paying special attention to air quality and municipal and other waste management

Target 11.6 has two indicators:

  • Indicator 11.6.1: Proportion of municipal solid waste collected and managed in controlled facilities out of total municipal waste generated, by cities

  • Indicator 11.6.2: Annual mean levels of fine particulate matter (e.g. PM2.5 and PM10) in cities (population weighted)

It’s ideal if we can process waste in a materials recovery facility. These separate recycled materials which are then sold on to make products from. Mechanical biological treatment uses the principles of composting or decomposition. Another solution is incineration, harnessing the resultant energy for re-use.

Before all this, it’s best if we’re able to prevent waste at all, before we either recycle, compost, or dispose of it. Each city municipality the world over will have different systems on how they manage their waste.

Very few countries had reported data on the proportion to which their municipalities managed waste. But all countries do have data on the second indicator of this target. Since 2015, the global average exposure to particulate matter of a size of 2.5 micrograms in diameter or less is 31 micrograms per cubic metre. This is a moderate decrease since 2015 of 36 micrograms.

Countries with an average of greater than 50 micrograms of PM2.5 per cubic metre include:

  • Niger

  • Nigeria

  • Cameroon

  • Egypt

  • Saudi Arabia

  • Qatar

  • Kuwait

  • Bahrain

  • Afghanistan

  • Tajikistan

  • Pakistan

  • India.

SDG Target #11.5

SDG #11 is to “Make cities and human settlements inclusive, safe, resilient and sustainable”

Within SDG #11 are 10 targets, of which we here focus on Target 11.5:

By 2030, significantly reduce the number of deaths and the number of people affected and substantially decrease the direct economic losses relative to global gross domestic product caused by disasters, including water-related disasters, with a focus on protecting the poor and people in vulnerable situations

Target 11.5 has three indicators:

  • Indicator 11.5.1: Number of deaths, missing persons and directly affected persons attributed to disasters per 100,000 population

  • Indicator 11.5.2: Direct economic loss attributed to disasters in relation to global gross domestic product (GDP)

  • Indicator 11.5.3: (a) Damage to critical infrastructure and (b) number of disruptions to basic services, attributed to disasters

Georgia had the highest rate of deaths and missing people per capita from natural disasters, with 303 per 100,000 in 2021.

The total global number of people affected by natural disaster has varied each year since the Goals’ adoption. The most people affected by disasters in this span was in 2016, with 395 million. The lowest year in this time was 2018, with 74 million. 2016 was also the year causing the most amount of people worldwide to become homeless due to disasters, totalling 2.4 million.

The highest death rates from disasters in the SDG period was 2023 with 1.08 per 100,000. 2016 was the least with 0.1 per 100,000. 2023 was also the highest year for injuries from disasters in the SDG period, totalling 151,420.

The highest death rate from disasters in 2023 was in Libya with 179 per 100,000 because of Storm Daniel and the collapse of the dams in Derna. This was equal to 12,352 deaths, exceeded for the year in total number by the earthquakes in Turkey and Syria, killing 50,840 in Turkey and 5,900 in Syria.

The country with the largest number of people displaced within its own borders in 2022 was Pakistan. 8.1 million Pakistanis lost their homes due to floods, followed by 5.5 million in the Philippines from tropical cyclones, and 3.6 million in China.

The biggest economic loss from natural disasters as a percentage of GDP was in Somalia, losing 5% of its economy’s 2022 output.

In the SDG period, 2017 was the year of biggest global economic losses as a part of the global economy, losing 0.4% gross world product to natural disasters.

SDG Target #11.4

SDG #11 is to “Make cities and human settlements inclusive, safe, resilient and sustainable”

Within SDG #11 are 10 targets, of which we here focus on Target 11.4:

Strengthen efforts to protect and safeguard the world’s cultural and natural heritage

Target 11.4 has one indicator:

  • Indicator 11.4.1: Total per capita expenditure on the preservation, protection and conservation of all cultural and natural heritage, by source of funding (public, private), type of heritage (cultural, natural) and level of government (national, regional, and local/municipal)

Only a small handful of countries have data for this indicator. Among those, the biggest spenders on cultural and natural heritage per capita are:

  • Luxembourg

  • Sweden

  • France

  • Switzerland

  • Czech Republic

  • Finland

  • Malta

  • Denmark

Each of these countries spent over $100 per capita on cultural and natural heritage.

SDG Target #11.3

SDG #11 is to “Make cities and human settlements inclusive, safe, resilient and sustainable”

Within SDG #11 are 10 targets, of which we here focus on Target 11.3:

By 2030, enhance inclusive and sustainable urbanization and capacity for participatory, integrated and sustainable human settlement planning and management in all countries

Target 11.3 has two indicators:

  • Indicator 11.3.1: Ratio of land consumption rate to population growth rate 

  • Indicator 11.3.2: Proportion of cities with a direct participation structure of civil society in urban planning and management that operates regularly and democratically 

As population’s grow, whether due to births or migration patterns, cities need to plan to accommodate these extra souls.

Although the UN has defined indicators for this target, countries have not collected enough data for UN Habitat to measure. Only a half-dozen countries have supplied data, and in each case, for only one city within their borders as of 2024.

SDG Target #11.2

SDG #11 is to “Make cities and human settlements inclusive, safe, resilient and sustainable”

Within SDG #11 are 10 targets, of which we here focus on Target 11.2:

By 2030, provide access to safe, affordable, accessible and sustainable transport systems for all, improving road safety, notably by expanding public transport, with special attention to the needs of those in vulnerable situations, women, children, persons with disabilities and older persons

Target 11.2 has one indicator:

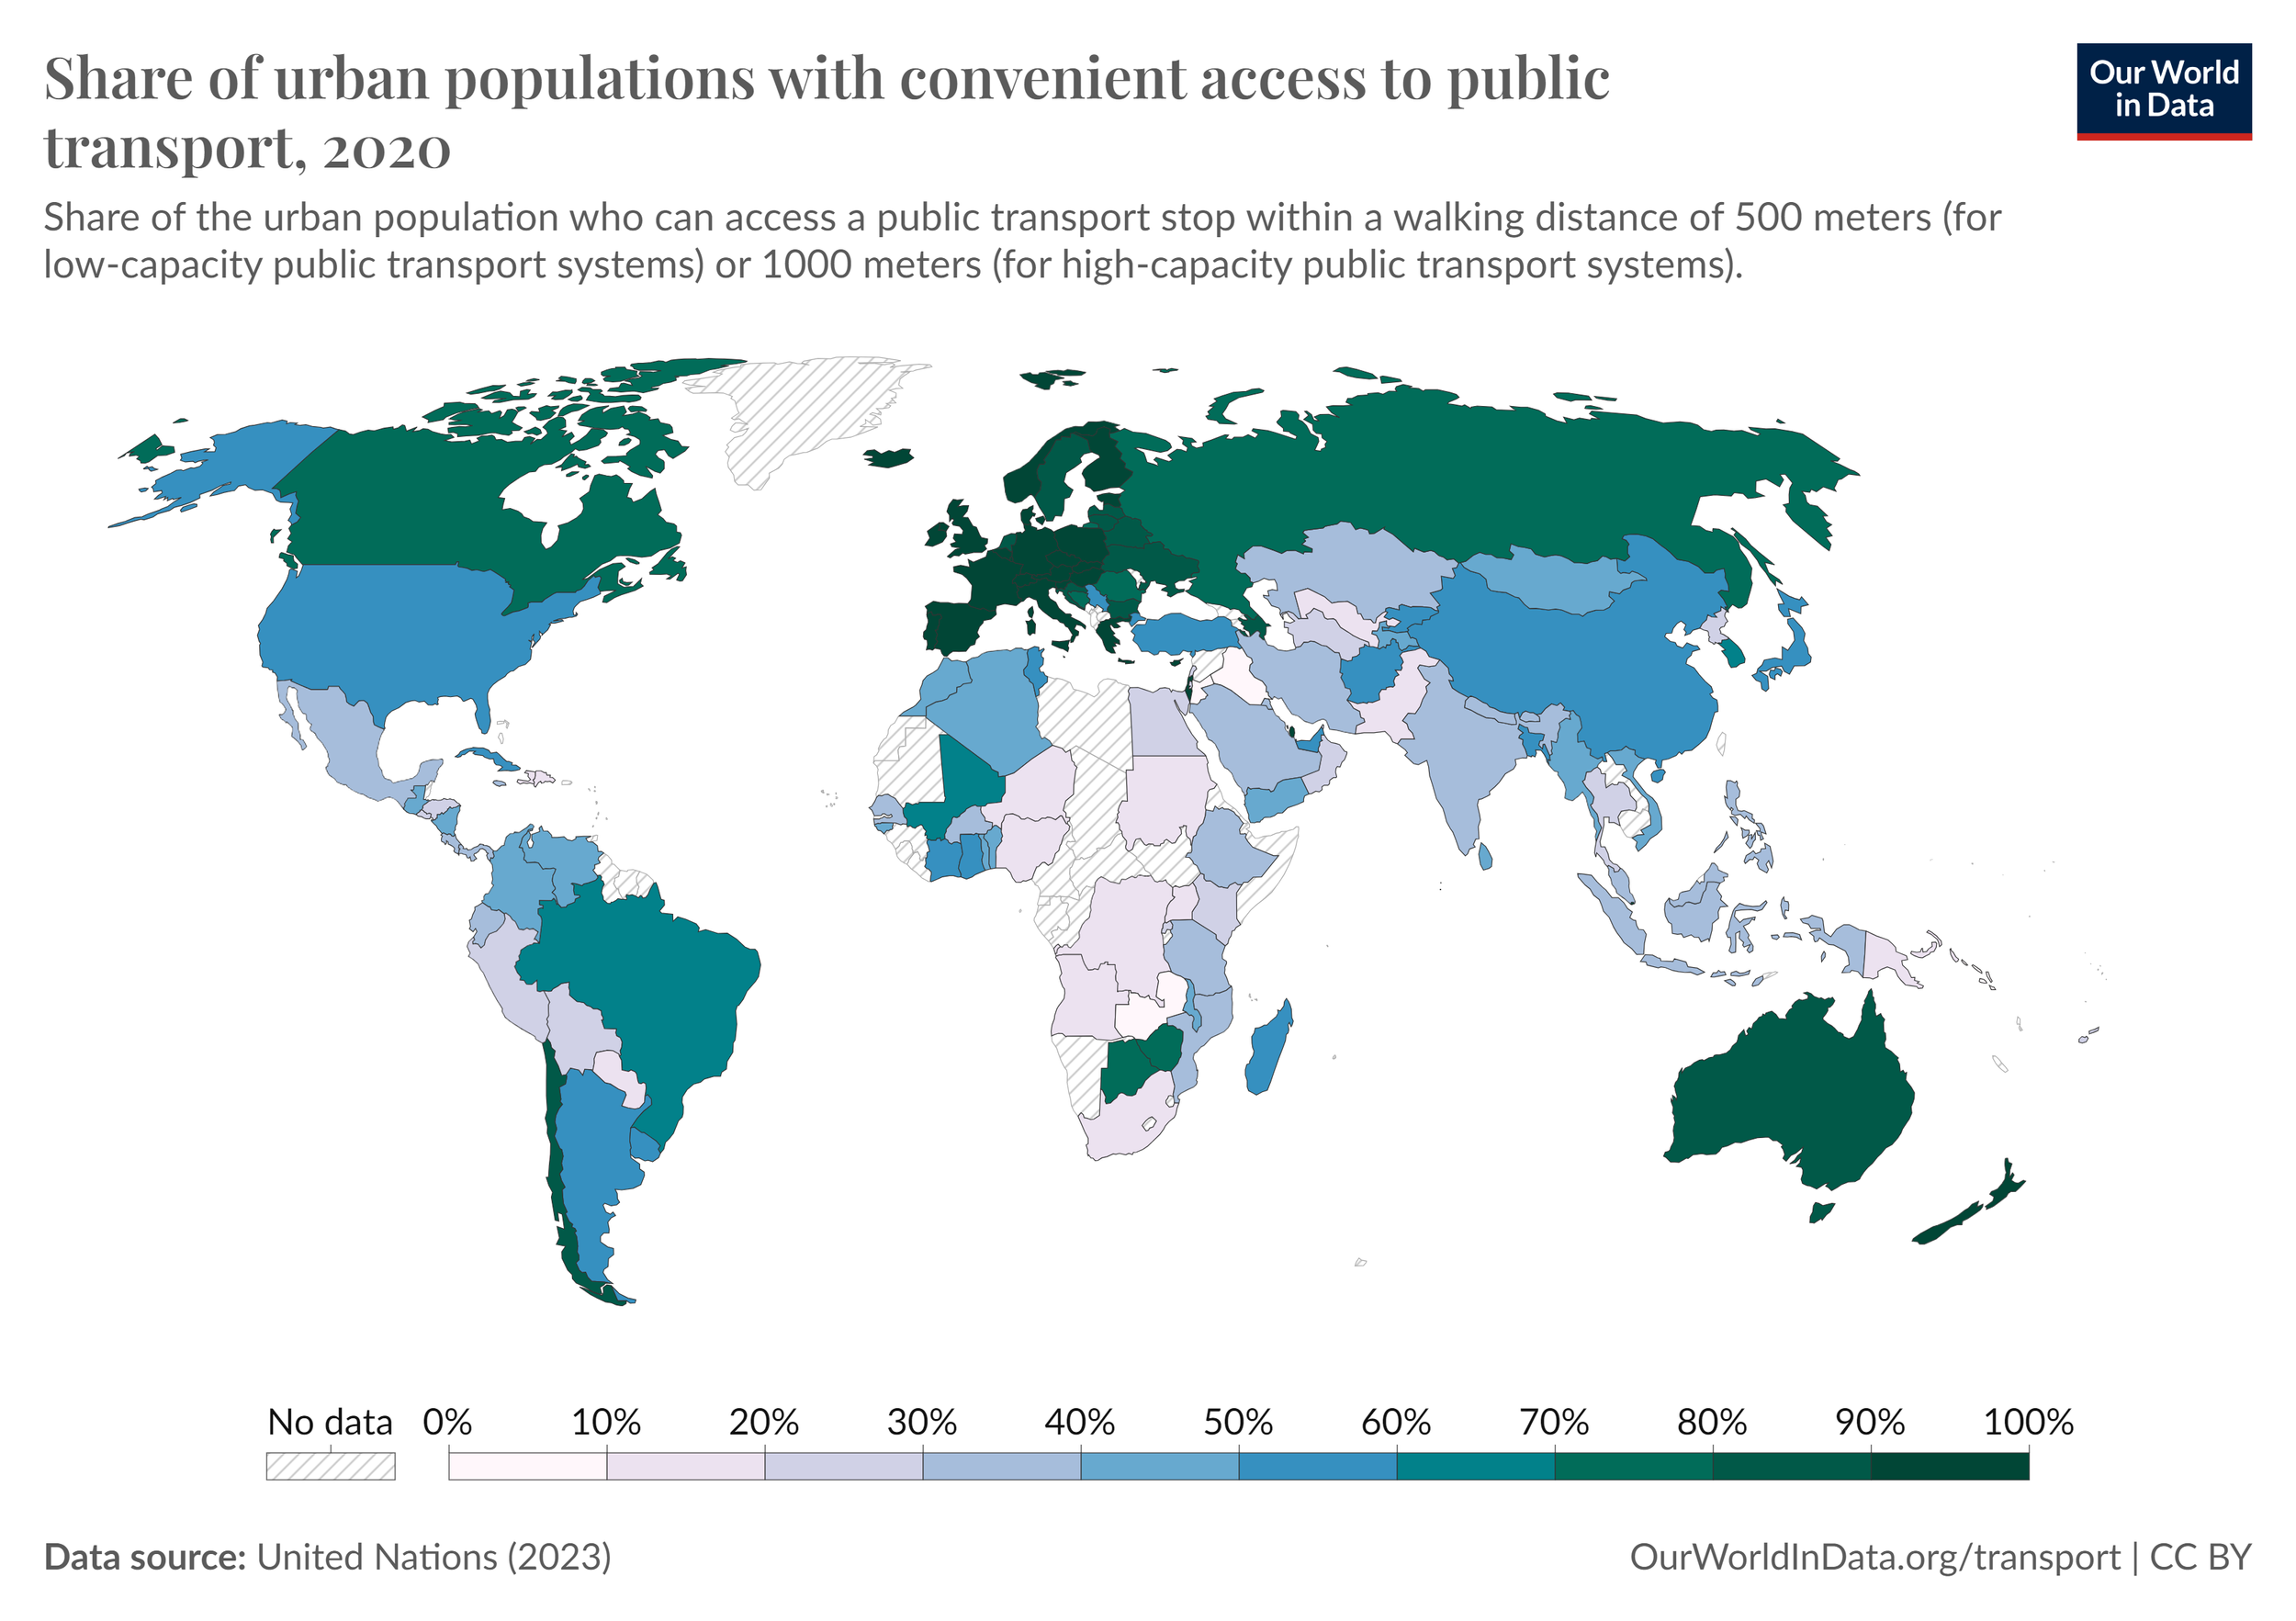
  • Indicator 11.2.1: Proportion of population that has convenient access to public transport, by sex, age and persons with disabilities

For public transport to be convenient, it must perform in adherence to the timetable and the routes must be able to meet capacity. For it to cater to those with special needs, paratransit services may need to be in effect to supplement the public routes.

The countries of the European single market take the lead for this indicator, alongside Israel and New Zealand. The populations of these and a handful of smaller states each had greater than 90% convenient access to public transport as of 2020.

Countries with less than 10% access were Zambia, Iraq, Jordan, and the Solomon Islands.

SDG Target #11.1

SDG #11 is to “Make cities and human settlements inclusive, safe, resilient and sustainable”

Within SDG #11 are 10 targets, of which we here focus on Target 11.1:

By 2030, ensure access for all to adequate, safe and affordable housing and basic services and upgrade slums

Target 11.1 has one indicator:

  • Indicator 11.1.1: Proportion of urban population living in slums, informal settlements or inadequate housing

UN-Habitat, also known as the UN Human Settlements Programme, is the agency with most relevance to SDG #11. Its efforts seek to uphold Article 25 of the Universal Declaration of Human Rights, which is: 

“Everyone has the right to a standard of living adequate for health and wellbeing.”

An estimated 1.6 billion people live in inadequate housing, a billion of these in slums and informal settlements. 

The year following the adoption of the SDGs, the UN held a conference known as Habitat III. This conference adopted the New Urban Agenda. The intent was for this to build on the 2030 Agenda which underpins the SDGs, with a particular focus on the topic of SDG #11. This conference was also known as the UN Conference on Housing and Sustainable Urban Development, held in Quito.

Target 11.1 of the Sustainable Development Goals carries on the work of target 7.d of the Millennium Development Goals, which was to: 

“Achieve, by 2020, a significant improvement in the lives of at least 100 million slum dwellers.”

The world met Target 7.D of the MDGs threefold, but the total number living in slums increased by 88 million over the MDG period between 2000-2015.

As of 2020, a quarter of the global population live in slums, informal settlements or inadequate housing. Among countries with data, South Sudan has the highest concentration with 94% of its population. Chad follows with 82%.

SDG Target #10.c

SDG #10 is to “Reduce inequality within and among countries.”

Within SDG #10 are 10 targets, of which we here focus on Target 10.c:

By 2030, reduce to less than 3 per cent the transaction costs of migrant remittances and eliminate remittance corridors with costs higher than 5 per cent

Target 10.c has one indicator:

  • Indicator 10.c.1: Remittance costs as a proportion of the amount remitted

A great many countries don’t have data for this indicator. Among those who do, Tanzania has the highest remittance costs as of 2021, with costs 28% of the value of the amount remitted.