SDG Target #10.b

SDG #10 is to “Reduce inequality within and among countries.”

Within SDG #10 are 10 targets, of which we here focus on Target 10.b:

Encourage official development assistance and financial flows, including foreign direct investment, to States where the need is greatest, in particular least developed countries, African countries, small island developing States and landlocked developing countries, in accordance with their national plans and programmes 

Target 10.b has one indicator:

  • Indicator 10.b.1: Total resource flows for development, by recipient and donor countries and type of flow (e.g. official development assistance, foreign direct investment and other flows)

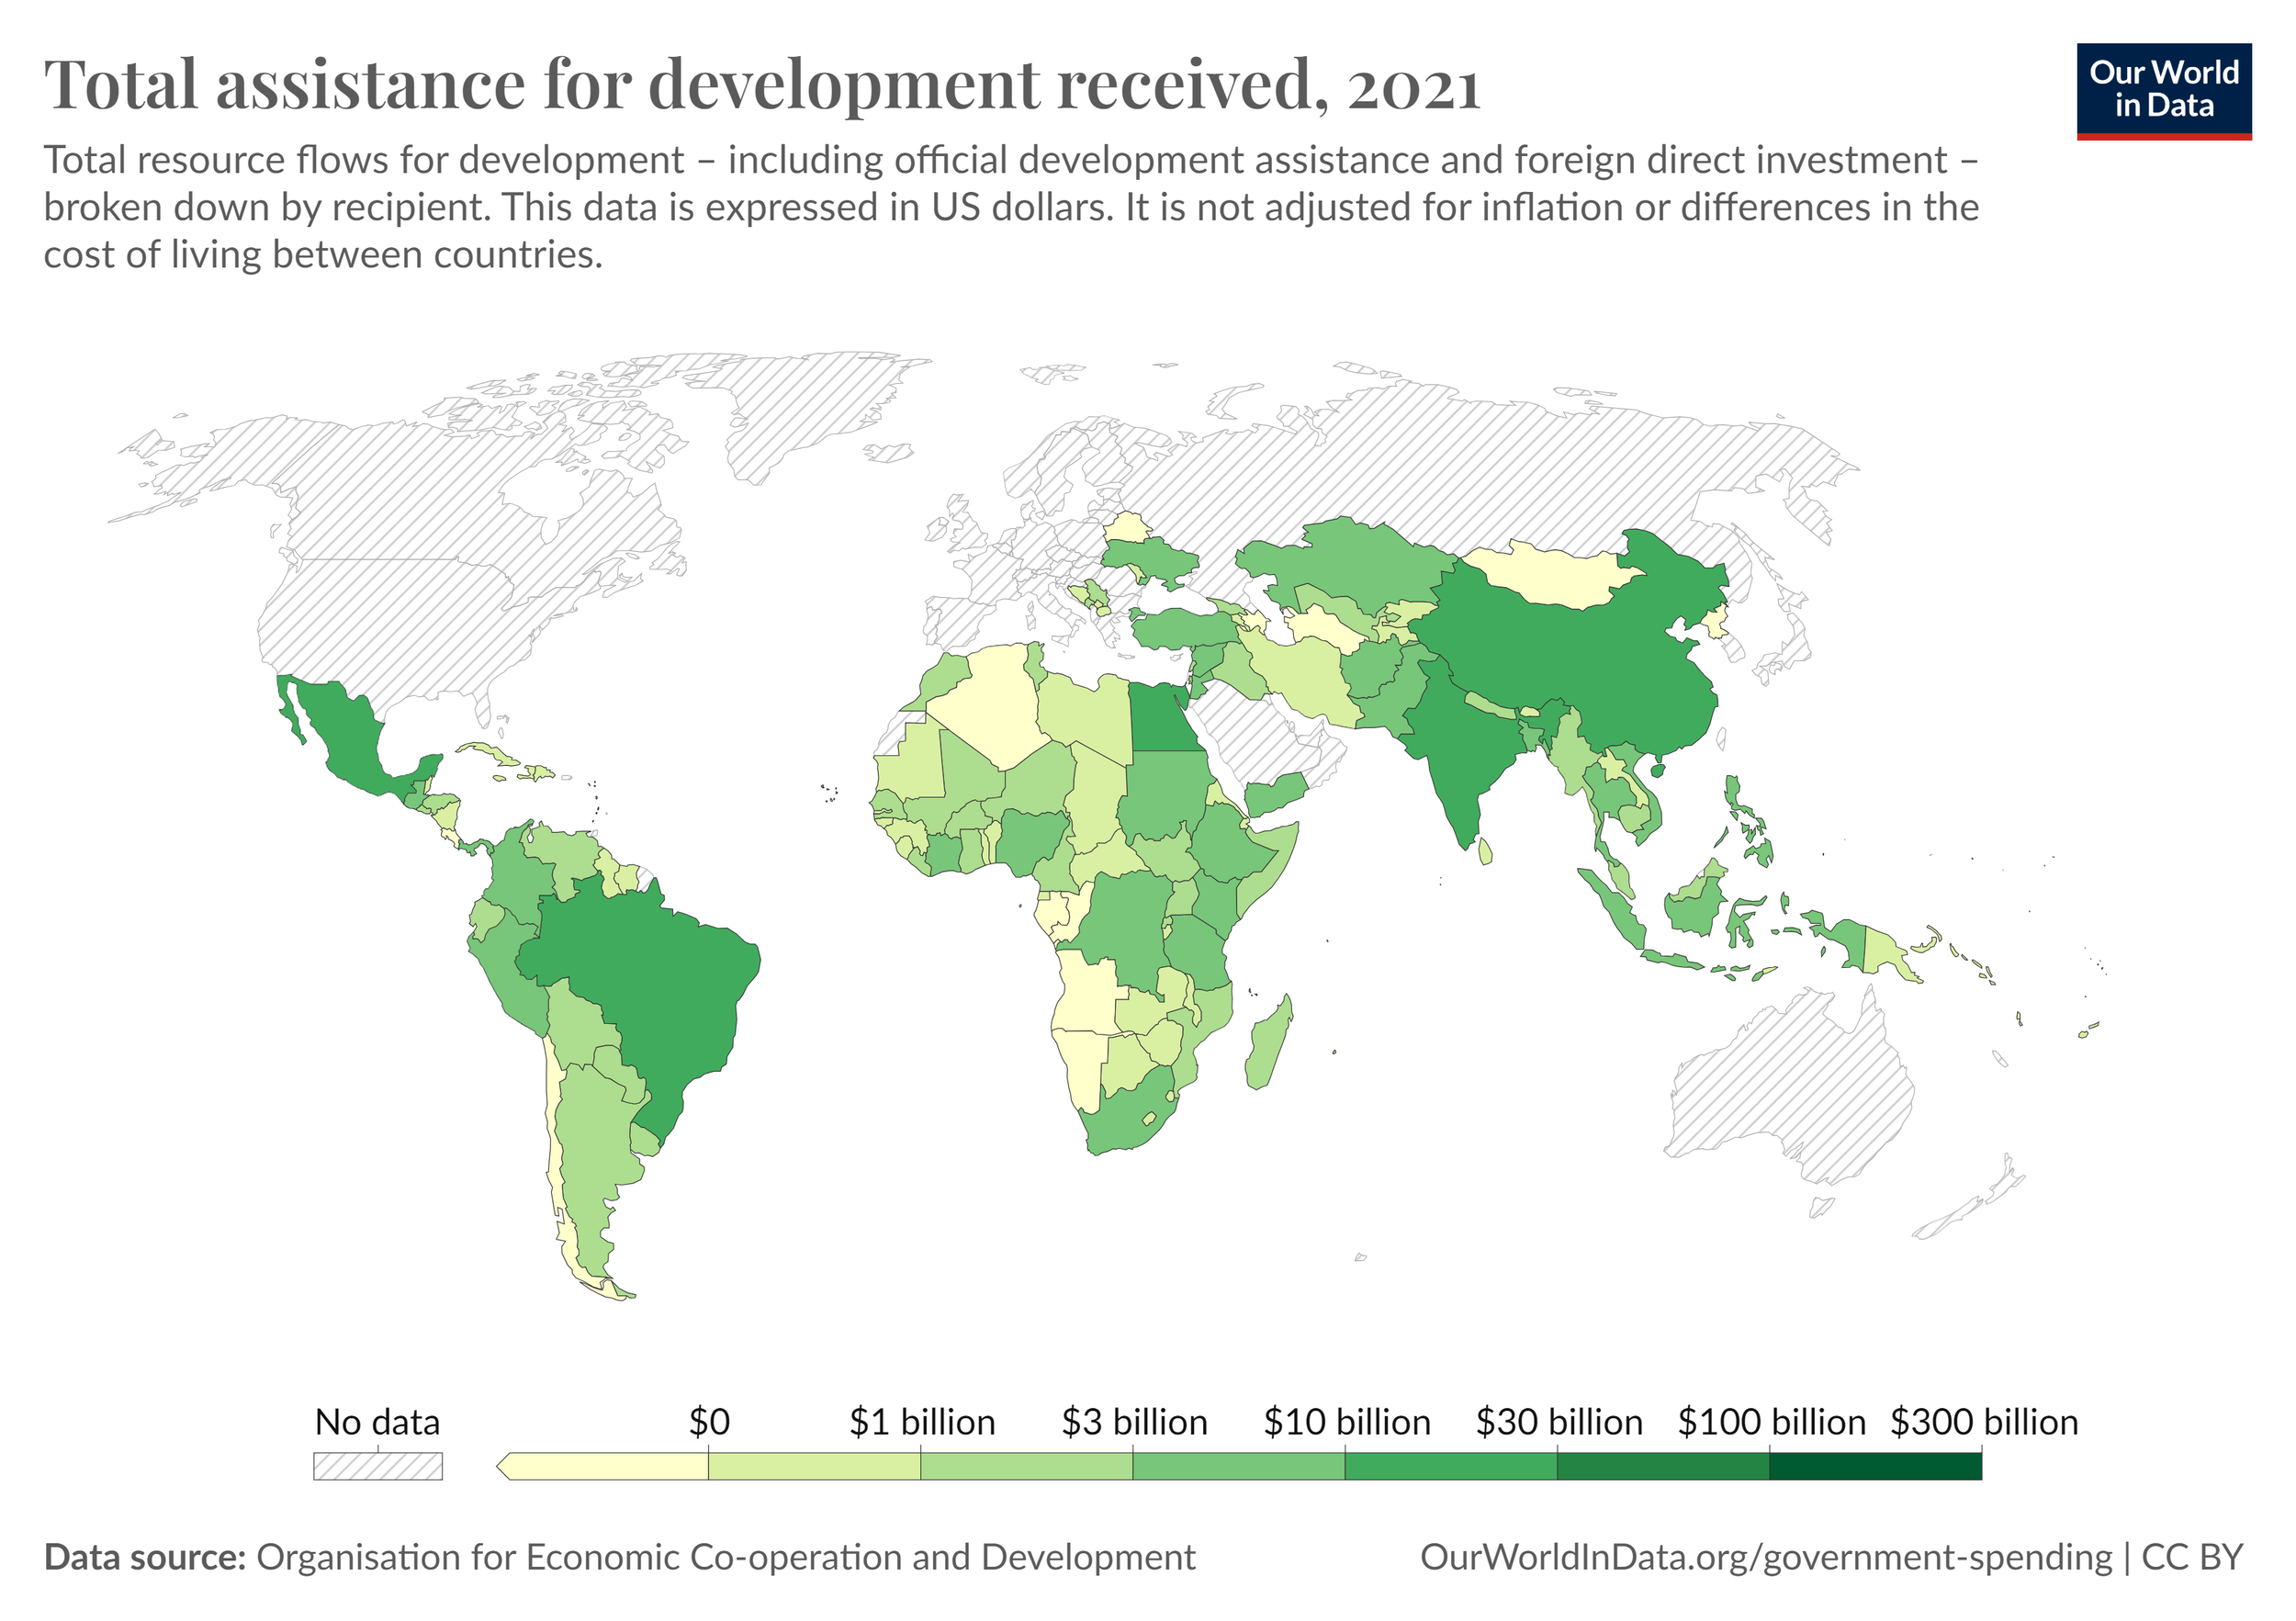
The biggest recipients of development aid are China, India, Egypt, Brazil, and Mexico, each receiving an annual $10-30 billion. The biggest donor government is the US, which is the leader by total sum, rather than as a proportion of their GDP. 

SDG Target #10.a

SDG #10 is to “Reduce inequality within and among countries.”

Within SDG #10 are 10 targets, of which we here focus on Target 10.a:

Implement the principle of special and differential treatment for developing countries, in particular least developed countries, in accordance with World Trade Organization agreements

Target 10.a has one indicator:

  • Indicator 10.a.1: Proportion of tariff lines applied to imports from least developed countries and developing countries with zero-tariff

Within trade, there’s what’s known as the Harmonized System, which is a standard for classifying types of goods. Some countries apply a separate code to certain goods imported into their country, known as the tariff line. This poses obstacles to trading partners. But countries can do the opposite and offer most favoured nation status to another country. Such differing treatment is in accordance with Target 10.a’s aim.

Worldwide, the share of imports from least developed countries which the importing country has waived all tariffs to zero is 57% as of 2021. The countries with the lowest tariffs on LDC imports are the microstates Liechtenstein and San Marino. North Korea is the only non-microstate to impose tariffs on less a quarter of all goods imported from LDCs. At the opposite end, Saint Lucia and Trinidad and Tobago in the Caribbean impose tariffs on more than 90% of goods from LDCs.

SDG Target #10.7

SDG #10 is to “Reduce inequality within and among countries.”

Within SDG #10 are 10 targets, of which we here focus on Target 10.7:

Facilitate orderly, safe, regular and responsible migration and mobility of people, including through the implementation of planned and well-managed migration policies

Target 10.7 has four indicators:

  • Indicator 10.7.1: Recruitment cost borne by employee as a proportion of monthly income earned in country of destination

  • Indicator 10.7.2: Proportion of countries with migration policies that facilitate orderly, safe, regular and responsible migration and mobility of people

  • Indicator 10.7.3: Number of people who died or disappeared in the process of migration towards an international destination

  • Indicator 10.7.4: Proportion of the population who are refugees, by country of origin

This target’s focus on migration introduces us to the work of the IOM, the UN’s migration agency.

There’s inadequate data for this target’s first indicator about the cost borne by a worker to find work abroad. But Bangladesh has data. It shows for 2020, it cost Bangladeshis travelling abroad the equal of 17 months pay to secure work.

In considering Indicator 10.7.2, of relevance is the IOM’s Migration Governance Framework. This sets out the principles to ensure “orderly, safe, regular and responsible migration.” The Framework guides governments how to plan for and manage migration. Among all countries, only 62 countries have policies meeting this criterion. 

Indicator 10.7.3 brings us to the work of the Missing Migrants Project. This tracks deaths along international migratory routes, amounting to an estimated 65,400 since 2014. In 2022, the Missing Migrants Project reported 5,935 migrants to have died or disappeared in such circumstances.

The UNHCR (UN High Commissioner for Refugees) is the UN’s refugee agency. The UNHCR works in complement with the IOM to support the 117.3 million displaced refugees worldwide as of 2023. One of the key international treaties guiding UNHCR’s work is the 1951 Refugee Convention.

The share of refugees among the world population as of 2022 was 398 per 100,000. Per country of origin, in 2022, the highest concentration of refugees came from:

  • Venezuela

  • Central African Republic

  • South Sudan

  • Eritrea

  • Ukraine

  • Syria

In each of these countries, between a tenth to a third of their respective populations had fled abroad as refugees.

SDG Target #10.6

SDG #10 is to “Reduce inequality within and among countries.”

Within SDG #10 are 10 targets, of which we here focus on Target 10.6:

Ensure enhanced representation and voice for developing countries in decision-making in global international economic and financial institutions in order to deliver more effective, credible, accountable and legitimate institutions

Target 10.6 has one indicator:

  • Indicator 10.6.1: Proportion of members and voting rights of developing countries in international organizations

The equality in representation this target aims for is reflective of Article 2 of the UN Charter

“The Organization is based on the principle of the sovereign equality of all its Members”

The international organisations used to measure this indicator for representation by LDCs are:

Previous targets within this series have mentioned many of these institutions. An exception are the regional development banks which offer investment in their regions. The two institutes mentioned under the umbrella of the World Bank are due to the World Bank Group consisting of five organisations. The Financial Stability Board serves a similar purpose to the Basel Committee mentioned in the previous target.

The proportion of member countries in these institutions as of 2022 are:

  • UN General Assembly; IMF & World Bank: 24%

  • UN Security Council: 6%, although the seats for non-permanent members rotates, so this figure has changed a couple times since 2015

  • UN Economic and Social Council: 13%

  • African Development Bank: 40%

  • Asian Development Bank: 16%

  • Inter-American Development Bank: only Haiti among 48 member countries

  • World Trade Organisation: 20%

  • Financial Stability Board: 0%

The share of LDCs by voting rights in these institutions are:

  • UN General Assembly: 24%

  • UN Security Council: 6%

  • UN Economic and Social Council: 13%

  • International Monetary Fund: 3%

  • World Bank Group

    • International Bank for Reconstruction and Development: 4%

    • International Finance Corporation: 2%

  • African Development Bank: 13%

  • Asian Development Bank: 4%

  • Inter-American Development Bank: 0.5%

  • World Trade Organisation: 20%

  • Financial Stability Board: 0%

SDG Target #10.5

SDG #10 is to “Reduce inequality within and among countries.”

Within SDG #10 are 10 targets, of which we here focus on Target 10.5:

Improve the regulation and monitoring of global financial markets and institutions and strengthen the implementation of such regulations

Target 10.5 has one indicator:

  • Indicator 10.5.1: Financial Soundness Indicators 

This target seeks to stem the risk to the global economy, or otherwise build its resilience, to shocks. It aims to identify vulnerabilities in the system ahead of time. The International Monetary Fund developed the Financial Soundness Indicators to measure this. Examples of the indicators include the number or value of non-performing loans held by banks which are late in repayment or unlikely to be repaid.

Why are calamities in financial markets relevant to Goal #10? Though they may wipe out the assets of the rich in the largest volumes, they're likely to affect the poorest the most in living standards.

A series of three agreements named after the Swiss city of Basel serve as rules for assets banks need to hold as a certain fraction of what they loan out. The intent is to avert crises in the global financial system, as experienced in 2007-08. These agreements are overseen by the Basel Committee on Banking Supervision. This committee, within the Bank of International Settlements, has international oversight of banks.

We’ll look at the performance of the world’s biggest financial market, which precipitated the crisis of 2007-08, the United States. We'll compare 2021 data to 2009, in the wake of the crisis.

Return on assets was 1.45% in 2021 compared to 0.22% in 2009. The amount of capital which banks must keep as a fraction of their lending was 8.62% in 2021, little different than in 2009. Non-performing loans were a 0.81% share of all loans in 2021, down from 5% of all loans in 2009.

SDG Target #10.4

SDG #10 is to “Reduce inequality within and among countries.”

Within SDG #10 are 10 targets, of which we here focus on Target 10.4:

Adopt policies, especially fiscal, wage and social protection policies, and progressively achieve greater equality

Target 10.4 has two indicators:

  • Indicator 10.4.1: Labour share of GDP

  • Indicator 10.4.2: Redistributive impact of fiscal policy

The biggest laggard of labour share of GDP as of 2020 is Venezuela, with only 10% of the country’s output going toward labour, the rest going toward capital.

By contrast, the world’s share of labour to gross world product is 54%, much the same since 2015. The world leaders are Switzerland and Nigeria, both with 68% labour share.

The Gini index measures the impact of polices intended for redistribution of income before and after taxes. The higher the Gini index number, the more unequal a country in income.

The leaders in progress for this measure are all European. This shouldn't be surprising, given the region has high tax rates. As of 2020, some of the most successful policies to address inequality present in:

  • Ireland

  • Belgium

  • Slovenia

  • France

  • Denmark

  • Austria

  • Finland.

Each of these countries managed to reduce their Gini index by a third or more via their taxation policies. Among countries with data, none managed to become less equal due to the country’s redistributive policies.

SDG Target #10.3

SDG #10 is to “Reduce inequality within and among countries.”

Within SDG #10 are 10 targets, of which we here focus on Target 10.3:

Ensure equal opportunity and reduce inequalities of outcome, including by eliminating discriminatory laws, policies and practices and promoting appropriate legislation, policies and action in this regard

Target 10.3 has one indicator:

  • Indicator 10.3.1: Proportion of population reporting having personally felt discriminated against or harassed in the previous 12 months on the basis of a ground of discrimination prohibited under international human rights law

Only a couple dozen countries have data for this indicator. Among these, the country reporting the highest rates of discrimination were in Tuvalu. There, a third of the population felt discriminated against in the previous year. Other countries reporting between a third and a quarter of the population reporting the same include:

  • Switzerland

  • Moldova

  • Israel

  • Central African Republic

  • Malawi

  • Zimbabwe

By contrast, the countries with rates below 5% include Vietnam, Cuba, Belarus, and Finland. The former two are communist countries, Belarus is in transition from one and Finland is social democratic. 

SDG Target #10.2

SDG #10 is to “Reduce inequality within and among countries.”

Within SDG #10 are 10 targets, of which we here focus on Target 10.2:

By 2030, empower and promote the social, economic and political inclusion of all, irrespective of age, sex, disability, race, ethnicity, origin, religion or economic or other status

Target 10.2 has one indicator:

  • Indicator 10.2.1: Proportion of people living below 50 per cent of median income, by sex, age and persons with disabilities

A quarter of the global population live below half the median income, unchanged since 2015. This proportion is equal to the worst performers for this measure across countries, on par with Honduras, which had the same share.

SDG Target #10.1

SDG #10 is to “Reduce inequality within and among countries.”

Within SDG #10 are 10 targets, of which we here focus on Target 10.1:

By 2030, progressively achieve and sustain income growth of the bottom 40 per cent of the population at a rate higher than the national average

Target 10.1 has one indicator:

  • Indicator 10.1.1: Growth rates of household expenditure or income per capita among the bottom 40 per cent of the population and the total population 

SDG #10 serves as a symbol of one of the three pillars of sustainable development: social inclusion. This means to share prosperity across society. Social inclusion ensures the alleviation of pockets of poverty not only across countries, but also within. Indicator 10.1.1 measures this via the growth rate of the income or consumption of the bottom 40% of the population by income.

The most impressive growth rate differential in income between the bottom 40% and the entire population was in Serbia. This country had a 2020 income growth rate for the bottom 40% of 13%, and 7% for the national average. In Myanmar, the 2022 income growth for the bottom 40% was 9%, and 1% for the national average. In the opposite direction, Mozambique had an income growth rate of 1.5% for the bottom 40% in 2022 and 5.4% for the national average.

SDG Target #9.c

SDG #9 is to “Build resilient infrastructure, promote inclusive and sustainable industrialization and foster innovation”

Within SDG #9 are 8 targets, of which we here focus on Target 9.c:

Significantly increase access to information and communications technology and strive to provide universal and affordable access to the Internet in least developed countries by 2020

Target 9.c has one indicator:

  • Indicator 9.c.1: Proportion of population covered by a mobile network, by technology 

As of 2022, 97% of the global population had access to 2G networks, an increase of a couple percentage points since 2015. 3G coverage was 95%, up from 78% in 2015. 4G access was 87%, up from 43% in 2015. 

Among the least developed countries, there was 91% access across the population, up from 86% in 2015. 4G access for the LDCs stood at 48% in 2022, up from 15%, demonstrating mobile phone coverage is one of the brightest spots in SDG progress. Yet this still missed the aim of Target 9.c for universal access to the internet for least developed countries by 2020. In 2020, 91% of the population of LDCs had access to 2G networks and 79% to 3G, short of the 100% access needed for universality.

SDG Target #9.b

SDG #9 is to “Build resilient infrastructure, promote inclusive and sustainable industrialization and foster innovation”

Within SDG #9 are 8 targets, of which we here focus on Target 9.b:

Support domestic technology development, research and innovation in developing countries, including by ensuring a conducive policy environment for, inter alia, industrial diversification and value addition to commodities

Target 9.b has one indicator:

  • Indicator 9.b.1: Proportion of medium and high-tech industry value added in total value added

The valued added from manufacturing in medium and high-tech industries implies an elevated level of R&D expenditure. The world leader by share of GDP from medium and high-tech value added as of 2020 is Singapore with 82%. Switzerland, South Korea, Qatar, and Germany each have a 60-65% share in their respective GDP’s. The world’s share is 45%. This hasn't changed since 2015. This is also the case with the least developed countries, which have a 10% share of their GDP for medium and high-tech industry value-added.

SDG Target #9.a

SDG #9 is to “Build resilient infrastructure, promote inclusive and sustainable industrialization and foster innovation”

Within SDG #9 are 8 targets, of which we here focus on Target 9.a:

Facilitate sustainable and resilient infrastructure development in developing countries through enhanced financial, technological and technical support to African countries, least developed countries, landlocked developing countries and small island developing States

Target 9.a has one indicator:

  • Indicator 9.a.1: Total official international support (official development assistance plus other official flows) to infrastructure

The biggest recipient country for aid earmarked for infrastructure as of 2021 was India, which received $7.51 billion.

Developing regions received aid of $64 billion for infrastructure in 2021, the same figure at the start of the SDG period in 2015. Infrastructure aid has also remained the same as 2015 for Africa, the least developed countries and small island states. Africa received $15 billion, the LDCs $11 billion and the SIDS close to $2 billion.

SDG Target #9.5

SDG #9 is to “Build resilient infrastructure, promote inclusive and sustainable industrialization and foster innovation”

Within SDG #9 are 8 targets, of which we here focus on Target 9.5:

Enhance scientific research, upgrade the technological capabilities of industrial sectors in all countries, in particular developing countries, including, by 2030, encouraging innovation and substantially increasing the number of research and development workers per 1 million people and public and private research and development spending

Target 9.5 has two indicators:

  • Indicator 9.5.1: Research and development expenditure as a proportion of GDP 

  • Indicator 9.5.2: Researchers (in full-time equivalent) per million inhabitants 

We can measure innovations in science and technology which allow the capacity of the industries to grow and countries to develop. One of the clearest measures is R&D expenditure as a percentage of GDP. The greatest spenders are the high-income countries, as well as China. But for the sake of this target, we want the developing countries to foster science and technology innovations. Spending on R&D as a share of the global world product is 2.7% as of 2021, which has risen a fractional amount since the start of the SDG period. This is an impressive share when considering its larger than China’s share, itself one of the leaders. Though it's still half of the leader, Israel, who has a 5.6% share.

The leaders for the measure of researchers in a country’s population comports with R&D expenditure. The worldwide total as of 2018 was 1,525 researchers per million people, a slight increase since 2015 from 1,385 per million. The world leader as of 2021 is South Korea with 9,082 researchers per million in the population. Korea's competitor for world leader in research, Israel, didn’t have data for this year for comparison.

SDG Target #9.4

SDG #9 is to “Build resilient infrastructure, promote inclusive and sustainable industrialization and foster innovation”

Within SDG #9 are 8 targets, of which we here focus on Target 9.4:

By 2030, upgrade infrastructure and retrofit industries to make them sustainable, with increased resource-use efficiency and greater adoption of clean and environmentally sound technologies and industrial processes, with all countries taking action in accordance with their respective capabilities

Target 9.4 has one indicator:

  • Indicator 9.4.1: CO2 emission per unit of value added 

Carbon dioxide is an 80% share of all greenhouse gas emissions from the energy used to power industrial processes, so it’s the focus on this indicator. 

As of 2018, the world emits 320 grams of carbon dioxide per dollar of value-added in the manufacturing sector. This figure hasn't unchanged since the most recent data around the adoption of the SDGs. The country with the most emissions per dollar of manufacturing value-added is Trinidad and Tobago with 1.16kg. Following is Mongolia with 1.09kg per dollar and North Korea with 1.18kg.

SDG Target #9.2

SDG #9 is to “Build resilient infrastructure, promote inclusive and sustainable industrialization and foster innovation”

Within SDG #9 are 8 targets, of which we here focus on Target 9.2:

Promote inclusive and sustainable industrialization and, by 2030, significantly raise industry’s share of employment and gross domestic product, in line with national circumstances, and double its share in least developed countries

Target 9.2 has two indicators:

  • Indicator 9.2.1: Manufacturing value added as a proportion of GDP and per capita 

  • Indicator 9.2.2: Manufacturing employment as a proportion of total employment 

Manufacturing value added is the dollar value of all the manufacturing output, minus any inputs. The world leader in manufacturing as a proportion of GDP as of 2022 is Ireland, with 38%, followed by Algeria, with 35%. Manufacturing as a part of gross world product was 16% in 2022, about the same since 2015 at the adoption of the SDGs. The more an economy develops, the further it tends to move away from manufacturing toward services. In the least developed countries, their economies instead have a high proportion of primary industry. Examples are agriculture, forestry, fishing, and resource extraction, which offer less value-added. This target has asked for manufacturing to double in the least developed countries. As a proxy for the least developed countries, manufacturing was 11% of the share of GDP in sub-Saharan Africa, up only 1% since the adoption of the Goals. In South Asia, manufacturing is 14% of the region’s GDP, a 1% decrease since 2015.

The leader in employment in manufacturing as a share of all employment is China, consisting of 28% of all jobs as of 2021. The worldwide share is 13%, about the same since the adoption of the Goals. For the least developed countries, the share was 8%, again unchanged since 2015.

SDG Target #9.1

SDG #9 is to “Build resilient infrastructure, promote inclusive and sustainable industrialization and foster innovation”

Within SDG #9 are 8 targets, of which we here focus on Target 9.1:

Develop quality, reliable, sustainable and resilient infrastructure, including regional and transborder infrastructure, to support economic development and human well-being, with a focus on affordable and equitable access for all

Target 9.1 has two indicators:

  • Indicator 9.1.1: Proportion of the rural population who live within 2 km of an all-season road 

  • Indicator 9.1.2: Passenger and freight volumes, by mode of transport 

The measure of rural population within 2km of an all-season road is a proxy for the Rural Access Index. A measure for the quality of roads to help deem it “all-season” is the International Roughness Index.

The countries with the lowest proportion of their rural population within 2km of an all-season road in 2021 were: 

  • Madagascar

  • Zambia

  • Lesotho

  • UAE 

Each had less than 20% access.

It's crucial for countries to have transport networks to foster trade and economic development. Such infrastructure needs to encourage sustainable transport. This means accessible, but also decarbonised, whether land-based, maritime or aviation.

The leader in passenger transport by rail is China, with passengers travelling 975 billion kilometres in 2021. By aviation, China was also a leader, with passengers travelling 655 billion kilometres in 2021. China was second to the US, which had 1.11 trillion km’s of a global total of 3.63 billion kilometres.

Measuring air freight by tonnes of kilometres flown, the US and China again lead in 2021. They had 46 billion and 21 billion tonne-kilometres, out of a worldwide total of 219 billion.

SDG Target #8b

SDG #8 is to “Promote sustained, inclusive and sustainable economic growth, full and productive employment and decent work for all.”

Within SDG #8 are 12 targets, of which we here focus on Target 8.b:

By 2020, develop and operationalize a global strategy for youth employment and implement the Global Jobs Pact of the International Labour Organization 

Target 8.b has one indicator:

  • Indicator 8.b.1: Existence of a developed and operationalized national strategy for youth employment, as a distinct strategy or as part of a national employment strategy

This target looks at whether each country has implemented legislation and policies intended to create jobs for youth. 

As of 2022, a large swath of countries is implementing a national strategy.

The Global Jobs Pact was an initiative of the UN in partnership with trade unions and employer’s organisations.

SDG Target #8a

SDG #8 is to “Promote sustained, inclusive and sustainable economic growth, full and productive employment and decent work for all.”

Within SDG #8 are 12 targets, of which we here focus on Target 8.a:

Increase Aid for Trade support for developing countries, in particular least developed countries, including through the Enhanced Integrated Framework for Trade-related Technical Assistance to Least Developed Countries

Target 8.a has one indicator:

  • Indicator 8.a.1: Aid for Trade commitments and disbursements  

Aid for Trade is an initiative of the World Trade Organization for high-income donor countries to help developing countries to trade to further their economic development.

An example of aid which might help towards this end is infrastructure, such as transport networks and utilities, which all enable economic activity.

For the high-income OECD countries which give development assistance, in reporting what they’ve given, we can also separate what they’ve given as intended for Aid for Trade. Based on this, the developing regions as a whole received $52.5 billion as Aid for Trade in 2021. This figure has gone up and down in the years since the adoption of the Goals in 2015, when it was $62 billion. For the least developed countries, 2021 Aid for Trade commitments were $18.8 billion. This has also varied year-on-year since 2015, when it was $19.8 billion. On sum, this trend has been missing Target 8.a’s aim to increase Aid for Trade support.

On the donor side, the largest 2021 commitments earmarked for Air for Trade came from Germany, giving $7.3 billion, and Japan, with $6.8 billion. 

SDG Target #8.10

SDG #8 is to “Promote sustained, inclusive and sustainable economic growth, full and productive employment and decent work for all.”

Within SDG #8 are 12 targets, of which we here focus on Target 8.10:

Strengthen the capacity of domestic financial institutions to encourage and expand access to banking, insurance and financial services for all

Target 8.10 has two indicators:

  • Indicator 8.10.1: (a) Number of commercial bank branches per 100,000 adults and (b) Number of automated teller machines (ATMs) per 100,000 adults

  • Indicator 8.10.2: Proportion of adults (15 years and older) with an account at a bank or other financial institution or with a mobile-money-service provider  

One aspect of social inclusion is financial inclusion. This has become much more accessible with the proliferation of digital payment platforms to give access.

Worldwide, the number of commercial bank branches per 100,000 adults was 11.2 as of 2021, about the same as 2015. For the same year, there were 39 ATMs per 100,000 people worldwide, a small increase from 36 in 2015.

The proportion of adults with a bank account or similar in 2021 was 76%, an increase since the Goals adoption of 62%.

SDG Target #8.9

SDG #8 is to “Promote sustained, inclusive and sustainable economic growth, full and productive employment and decent work for all.”

Within SDG #8 are 12 targets, of which we here focus on Target 8.9:

By 2030, devise and implement policies to promote sustainable tourism that creates jobs and promotes local culture and products

Target 8.9 has one indicator:

  • Indicator 8.9.1: Tourism direct GDP as a proportion of total GDP and in growth rate  

This target introduces us to the work of another of the UN agencies, UN Tourism.

Tourism direct GDP, as measured in this Target’s sole indicator is the value-added by all industries contributing to tourism.

The global share of tourism direct GDP as a proportion of gross world product is 2.54% as of 2021. This is lower than at the adoption of the SDGs in 2015, when it was 3.75%.

The world leaders among countries with data in the SDG period are Fiji with 12% in 2019. For those with more recent data up to 2021, the leaders were Greece and UAE with 6%.