
Dashboard map for 2022 SDG Index Goal #6 ratings. Data source: sdgindex.org
Population using at least basic drinking water services (%)
As of 2020, 90% of the world has basic drinking water services, with a steady upward trend since the start of the MDG period. Yet the 10% left over is still too much, with the 2022 SDG Index scores showing us the LDCs scoring red for this indicator. We’re aiming for 100% of the population to use basic drinking water services, defined as an ‘improved source’, meaning due to its “design and construction it has the potential to deliver safe water”. This definition is further categorised by whether the water is accessible on the premises, available when needed, and free from contamination.
Types of unimproved sources include:
unprotected springs and wells
surface water from sources such as rivers, dams, lakes, streams, and irrigation canals
An example of an improved source is:
water piped to the home
protected wells and springs
harvested rainwater
packaged or delivered water
Per the definition of this indicator, a ‘basic drinking water service’ is an ‘improved water source’, requiring a 30-minute or less round trip, including queuing. The definition of a source taking longer is ‘limited’, in contrast to ‘basic’.
To make this a little easier to conceptualise, UNICEF and the WHO use a ladder of drinking water:
Consider the role drinking water has in your life, and how you depend on its quality. You rely on it for basic survival, secondary in urgency to oxygen. Our planet’s surface area is 71% water, but 96.5% of this is saline, with only 2.5% fresh water.
Diarrhoea is the second leading cause of death of children under 5, killing over half a million every year. Imagine your parents conceiving you, brought to term by your mother, only losing you to diarrhoea within 5 years of birth. When I picture the children in my life below age 5, the thought of them dying is shocking. If the cause were something as feeble and preventable as diarrhoea, it’d be even more senseless.
How are you going to respond to this challenge to make up the shortfall of the 10% of the global population without basic drinking water services? You’re a step ahead of me. You’ve already concluded that because the countries far off-track are LDCs, the responsibility falls upon the DAC country readers to finance what's required to provide basic drinking water services.
The main point is providing quality drinking water up to the standard of the ‘basic’ rung on the above ladder, meaning free of pollution, including when the pollutants originate from the original groundwater.
Summary: For OECD country readers, affirm your annual commitment to give 0.7% of your gross income as aid, aiming for all to have at least basic drinking water services by 2030.
Population using at least basic sanitation services (%)
A similar worded indicator to before, albeit focused upon sanitation, in contrast to drinking water, aiming for 100% coverage of a population using basic sanitation, to bridge the gap of 78% of the world population.
The definition of an improved facility is designed to separate human waste from human contact, meaning it’s:
not shared with other households
treats the waste and disposes of it on-site
stored, then emptied, and treated off-site
transported via a sewer along with wastewater, and treated off-site
Examples of improved sources include:
flush toilets (connected to a sewer, septic tank, or pit latrine)
pit latrines, with slabs covering the pit
composting toilets
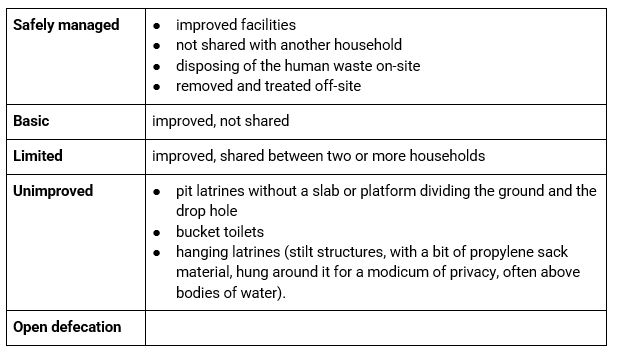
UNICEF and the WHO likewise has a ladder for sanitation, as it does for drinking water:

What to do? We’ll follow the same prescription as above for water, with LDC countries cared for by the foreign aid donations from our DAC readers.
What about middle-income countries? As mentioned earlier, DAC aid reaches recipients beyond the LDCs prioritised as neediest, but for this indicator, we have middle-income countries with portions of the population still living in extreme poverty. South Asia has scored red in the 2022 SDG Index for this indicator, as have Mongolia, Papua New Guinea, Bolivia, Nicaragua and Guatemala.
Let’s lean on the ability of foreign aid to resolve this. In the event you’re reading this perched on the stilts of a hanging latrine, then above is the standard of what’s required for a ‘basic’ sanitation service where you live to help you to meet this indicator of 100% of the population.
Summary:
For OECD country readers, affirm your annual commitment to give 0.7% of your gross income as aid, aiming for all to have at least basic sanitation services by 2030.
For readers in countries off-track, use a basic sanitation service from an improved sanitation facility, where available.
Freshwater withdrawal (% of available freshwater resources)
Water is renewable but finite, so we’re considering the measure of all available renewable resources, minus what’s required by the environment. By 2030, the aim is a withdrawal of 12.5 % of available freshwater sources or less. In an era of increasing climate change, what was already a swath of dryland (Middle East and North Africa; Central and South Asia) will face increasing pressures on freshwater withdrawal.
This indicator reflects water stress, measuring the proportion of freshwater withdrawn from all freshwater sources, applied to households, but also, due to the scale of their withdrawal, from industry. So please take heed if you’re a business owner, or if your influence in your role as an employee affects the outcome of freshwater withdrawal. This takes on pertinence within the industries of agriculture, forestry and fishing, manufacturing, and the electricity sector. Some common uses for these sectors include public water supply and irrigation, industrial processes, and electric power plant cooling. Agriculture accounts for 70% of the freshwater withdrawal. Food production has doubled in the past three decades, with estimates we’ll need 60% more food by mid-century, along with the accompanying intensity of water withdrawals.
In a household, most adults have a sense of how best to economise on using freshwater, so our focus turns toward agriculture. Very few readers will work in the agricultural sector. Agricultural productivity is important, though heading further into this century, we’ll be asking more of the planet to feed more human mouths. Our demand and consumption affect what is produced by the agricultural sector, thus easing production eases the demand for freshwater sources. We need to harness agricultural technology and emphasise those techniques making efficiency gains, both in water use, but also cost. We’re looking for water productivity i.e., a good crop yield compared to the ratio of water used. This is done by improving irrigation and water management, including efficiency. One of the means of this is through drip irrigation via pressurised pipes, rather than surface irrigation. Maximising outputs and minimising inputs are central, being mindful of natural resources. As a consumer or an intermediary in the supply chain, you can do your bit from contributing to food waste. Importing food may become a reality for some countries off-track for this indicator, if they continue to be unable to meet the needs of domestic irrigation, a drawback we’ll face again in the next indicator. North Africa and the Middle East may need to look past agriculture and industrial processes as a living, as it’s appearing unsustainable unless the inputs of water are more efficient, or the government or private sector remediate this.
Summary: For readers in countries off-track, conserve water and use efficiently, in residential, agricultural, and commercial settings, aiming for a national withdrawal of 12.5% or less of available freshwater resources by 2030.
Anthropogenic wastewater that receives treatment (%)
This indicator aims to treat 100% of wastewater for contamination of pollutants, either via sewage from the community, or industrial and agricultural treatment. Only then should we release the wastewater as effluent back into the water cycle.
There are three steps of treatment. The first, ‘primary treatment’, means wastewater has undergone an initial separation of any suspended solids and organic matter. Following is ‘secondary treatment’, removing biodegradable matter, then more advanced ‘tertiary treatment’. To count for this indicator, we need the wastewater to receive primary treatment.
Agriculture wastewater treatment treats the waste of farmed animals, and surface runoff from the soil after rain, which may contain residues of fertilisers, pesticides, and manure. Important to treat also is leachate, the liquid from landfills containing soluble matter, which if untreated, may contaminate the water cycle.
At large scale, sewerage systems are infrastructural operations requiring very large investments by governments, thus out of the scope of individual readers. Nevertheless, below are some actions readers can take.
Summary:
For OECD country readers, annually give 0.7% of your gross income as aid, aiming for the treatment of all wastewater by 2030.
For middle income countries off-track, if unconnected to a sewerage system able to treat waste, install an onsite sewage facility e.g., septic tank, or decentralised wastewater system, if affordable.
Scarce water consumption embodied in imports (m³/capita)
This indicator looks at the international trade of scarce water, entailing a concept known as ‘virtual water’ i.e., water embodied in the trade of commodities. But what if a country imports commodities from another country which itself has scarce water resources? This latter point is the focus of this indicator, measuring the per capita consumption of scarce water resources imported.
For countries off-track, this means being mindful of which countries are experiencing water stress, visible by referring to the earlier indicator for freshwater withdrawal. The results demonstrate the desert climates of North Africa, West Asia and Central Asia as experiencing the most water stress. Therefore, for readers from countries off-track, it’s important to be mindful of your consumption behaviour relating to commodities imported from these regions. These ecosystems have less water resources to supply for irrigation than it's able to manage to support the export of commodities, which climate change and water pollution exacerbates.
Summary: For readers in countries off-track, substitute commodities imported from regions experiencing water scarcity. The national aim is to keep the consumption of scarce water embedded in imports to the equivalent of 100m³ of water per capita by 2030.
Population using safely managed water services (%) *
We saw earlier what ‘safely managed water services’ means. The aim by 2030 is for the whole population of an OECD country to be using 'safely managed water services’. Only the middle-income OECD countries of Mexico and Colombia scored red for this indicator in the 2022 scores.
Summary: For readers in OECD countries off-track, use safely managed water services where available, aiming for all to use safely managed water services by 2030.
Population using safely managed sanitation services (%) *
This indicator is identical to the prior indicator, except for sanitation, with Mexico and Colombia again scoring red, plus Costa Rica. The task for readers from these countries is to meet the standard of a 'safely managed sanitation service', a rung on the ladder mentioned above in the basic sanitation indicator.
Summary: For readers in countries off-track, use safely managed sanitation services where available, aiming for all to use safely managed sanitation services by 2030.